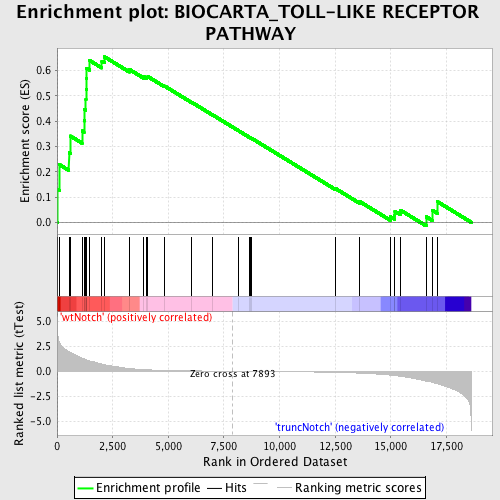
Profile of the Running ES Score & Positions of GeneSet Members on the Rank Ordered List
| Dataset | Set_03_truncNotch_versus_wtNotch.phenotype_truncNotch_versus_wtNotch.cls #wtNotch_versus_truncNotch.phenotype_truncNotch_versus_wtNotch.cls #wtNotch_versus_truncNotch_repos |
| Phenotype | phenotype_truncNotch_versus_wtNotch.cls#wtNotch_versus_truncNotch_repos |
| Upregulated in class | wtNotch |
| GeneSet | BIOCARTA_TOLL-LIKE RECEPTOR PATHWAY |
| Enrichment Score (ES) | 0.6545768 |
| Normalized Enrichment Score (NES) | 1.6314315 |
| Nominal p-value | 0.0075949365 |
| FDR q-value | 0.20393208 |
| FWER p-Value | 0.877 |
| PROBE | DESCRIPTION (from dataset) | GENE SYMBOL | GENE_TITLE | RANK IN GENE LIST | RANK METRIC SCORE | RUNNING ES | CORE ENRICHMENT | |
|---|---|---|---|---|---|---|---|---|
| 1 | MAP3K1 | 5360347 | 32 | 3.533 | 0.1283 | Yes | ||
| 2 | CHUK | 7050736 | 113 | 2.821 | 0.2279 | Yes | ||
| 3 | MAP3K7 | 6040068 | 534 | 1.929 | 0.2763 | Yes | ||
| 4 | MAP2K4 | 5130133 | 595 | 1.863 | 0.3416 | Yes | ||
| 5 | MAP3K7IP2 | 2340242 | 1123 | 1.315 | 0.3617 | Yes | ||
| 6 | IKBKB | 6840072 | 1212 | 1.233 | 0.4023 | Yes | ||
| 7 | TOLLIP | 5340601 6200465 | 1240 | 1.210 | 0.4454 | Yes | ||
| 8 | MAP3K7IP1 | 2120095 5890452 6040167 | 1294 | 1.155 | 0.4850 | Yes | ||
| 9 | MAPK14 | 5290731 | 1301 | 1.150 | 0.5270 | Yes | ||
| 10 | MAP3K14 | 5890435 | 1319 | 1.137 | 0.5680 | Yes | ||
| 11 | EIF2AK2 | 870239 | 1329 | 1.132 | 0.6092 | Yes | ||
| 12 | LY96 | 630519 | 1464 | 1.032 | 0.6400 | Yes | ||
| 13 | MAPK8 | 2640195 | 2013 | 0.718 | 0.6369 | Yes | ||
| 14 | TRAF6 | 4810292 6200132 | 2133 | 0.654 | 0.6546 | Yes | ||
| 15 | TIRAP | 60129 6400097 | 3250 | 0.277 | 0.6047 | No | ||
| 16 | TLR7 | 3140300 | 3902 | 0.158 | 0.5755 | No | ||
| 17 | MAP2K6 | 1230056 2940204 | 4023 | 0.145 | 0.5744 | No | ||
| 18 | RELA | 3830075 | 4082 | 0.138 | 0.5763 | No | ||
| 19 | IKBKG | 3450092 3840377 6590592 | 4826 | 0.082 | 0.5393 | No | ||
| 20 | TLR3 | 6760451 | 6033 | 0.036 | 0.4758 | No | ||
| 21 | TLR6 | 510102 3390148 | 7006 | 0.015 | 0.4240 | No | ||
| 22 | PPARA | 2060026 | 8143 | -0.004 | 0.3630 | No | ||
| 23 | MYD88 | 2100717 | 8644 | -0.012 | 0.3366 | No | ||
| 24 | ECSIT | 3850170 | 8671 | -0.013 | 0.3356 | No | ||
| 25 | TLR9 | 670093 670706 | 8738 | -0.014 | 0.3326 | No | ||
| 26 | JUN | 840170 | 12506 | -0.114 | 0.1341 | No | ||
| 27 | MAP2K3 | 5570193 | 13606 | -0.191 | 0.0820 | No | ||
| 28 | FOS | 1850315 | 14971 | -0.386 | 0.0228 | No | ||
| 29 | TLR2 | 5050162 | 15174 | -0.429 | 0.0277 | No | ||
| 30 | TLR4 | 1690167 2650369 3850333 | 15184 | -0.431 | 0.0431 | No | ||
| 31 | IRAK1 | 4120593 | 15431 | -0.499 | 0.0482 | No | ||
| 32 | CD14 | 5570600 | 16594 | -0.987 | 0.0220 | No | ||
| 33 | NFKBIA | 1570152 | 16859 | -1.101 | 0.0483 | No | ||
| 34 | PGLYRP1 | 6760242 | 17089 | -1.254 | 0.0822 | No |

